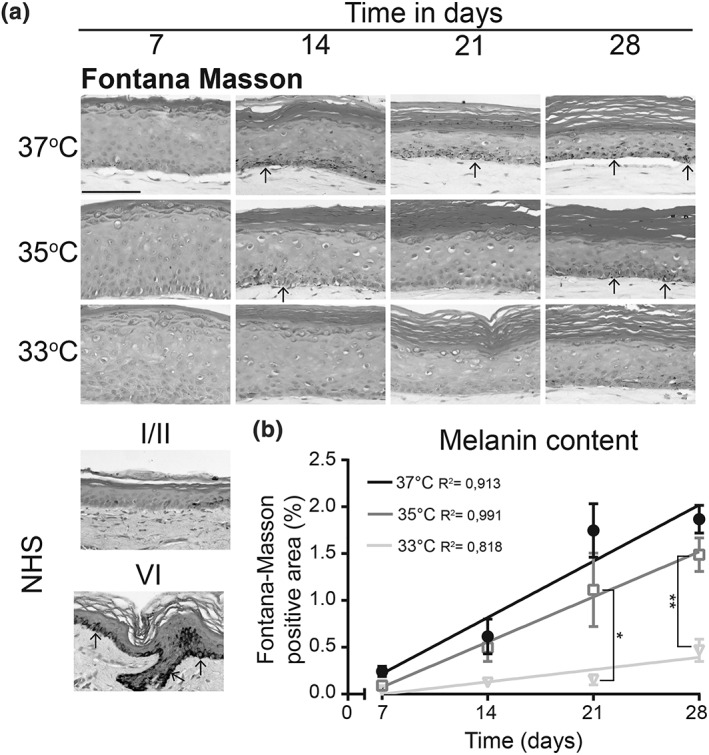
Figure 3.

Melanogenesis in full thickness models generated at different temperatures over time. (a) Fontana‐Masson silver staining of melanin in full thickness models developed at different temperatures over time and in NHS phototype I/II and phototype VI. Epidermis is counterstained with nuclear fast red. Arrowheads indicate melanin position. Scale bar indicates 100 μm. (b) Quantified melanin content in the viable epidermis plotted as Fontana‐Masson positive area as percentage of the total area. Data represent mean ± SEM, n ≥ 2, and are fitted with a linear regression line. NHS, native human skin
