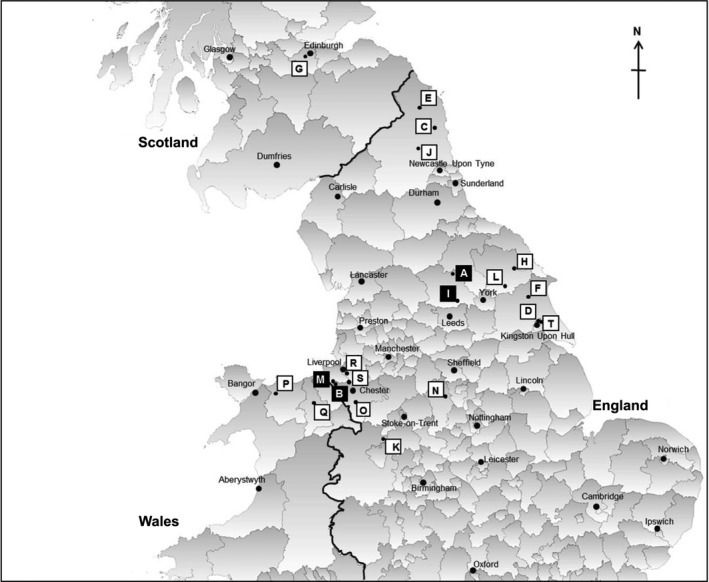
Figure 1.

Map indicating the locations of the sites sampled in this study. The site I.D.s correspond to those shown in Table 1. The black squares ■ indicate the sites where HEV‐positive rats were detected (sites A, B, I, M). This map was created using GQIS Desktop V.3.2.3 software
