Figure 1.

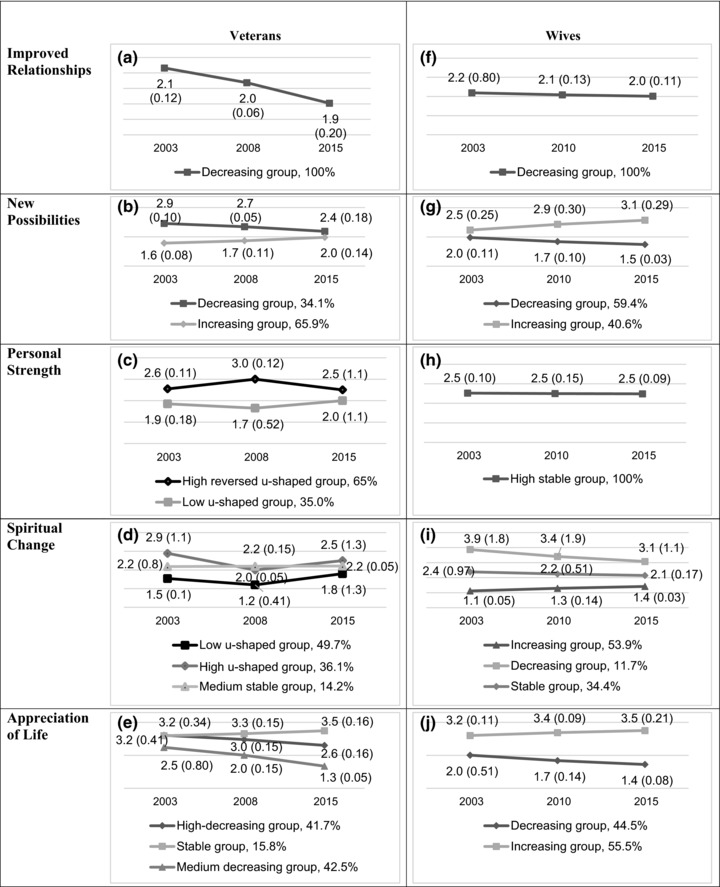
Posttraumatic growth (PTG) trajectories for veterans and their wives, according to PTG dimensions. Numbers in the graphs represent means and standard deviations.

Posttraumatic growth (PTG) trajectories for veterans and their wives, according to PTG dimensions. Numbers in the graphs represent means and standard deviations.