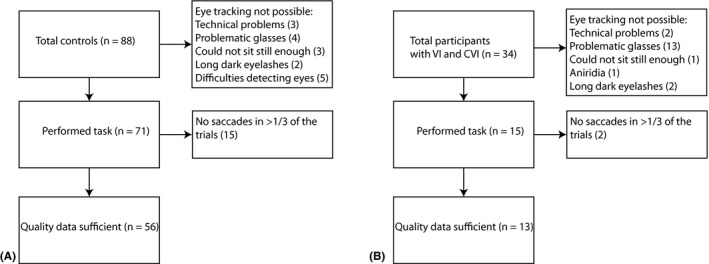
Figure 3.

Flow chart showing the total number participants, the number of children in which we could collect eye tracking data, and the number of children in which the quality of the eye tracking data was deemed sufficient for analysis for (A) children with normal vision, and (B) children with visual impairments. In case eye tracking was not possible, the main reason why the eye tracking failed is listed.
