Figure 6.

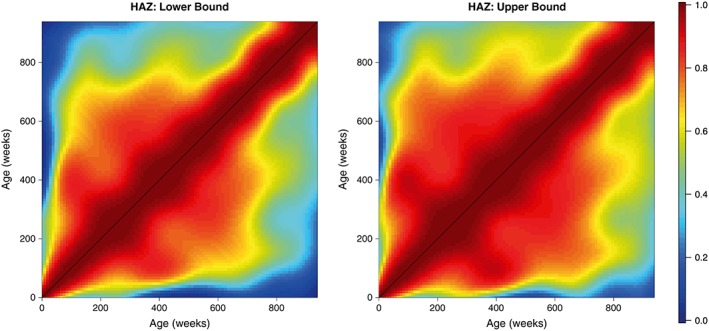
The lower and upper bounds of the height‐for‐age Z‐scores (HAZ) correlation matrix, calculated by smoothing the incomplete lower and upper confidence surfaces [Colour figure can be viewed at wileyonlinelibrary.com]

The lower and upper bounds of the height‐for‐age Z‐scores (HAZ) correlation matrix, calculated by smoothing the incomplete lower and upper confidence surfaces [Colour figure can be viewed at wileyonlinelibrary.com]