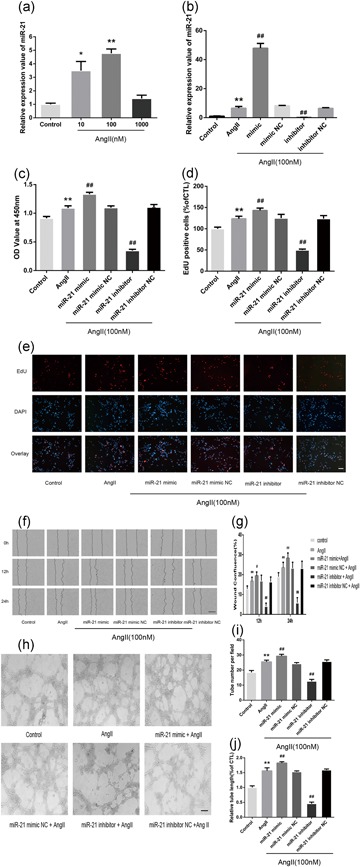
Figure 2.

miR‐21 upregulation is associated with AngII‐induced angiogenesis in HMECs. (a) qPCR analysis of the relative expression value of miR‐21 in HMECs after incubation with different concentrations (0, 10, 100, and 1,000 nM) of AngII for 24 hr (n = 3). (b) miR‐21 expression in HMECs was detected by real‐time PCR after transfection (n = 3). (c) CCK‐8 assays were used to detect cell proliferation after transfection (n = 4). (d,e) Representative images of the EdU assay (e) and the quantified number of EdU‐positive cells. The miR‐21 inhibitor offset the AngII‐induced increase in HMEC proliferation, while the miR‐21 mimic exerted the opposite effect (d; n = 3). (f) Representative images of HMECs after wounding from the indicated experimental groups. (g) Relative wound confluence of HMECs 24 hr after the transfection of hsa‐miR‐21 mimic, hsa‐miR‐21 inhibitor, and their respective negative controls (n = 3). (h) Representative images portraying the formation of capillary‐like tubes in HMECs after the indicated transfections. (i,j) HMEC branch number and length. All data are presented as the mean ± standard deviation. *p < 0.05 vs. con. **p < 0.01 vs. con. # p < 0.05 vs. AngII. ## p < 0.01 vs. AngII. The scale bars in Figure 2e,h represent 80 μm and in Figure 2f represent 400 μm. AngII: angiotensin II; CCK‐8: cell counting kit‐8; HMEC: human microvascular endothelial cell; miR‐21: miRNA‐21; qPCR: quantitative PCR
