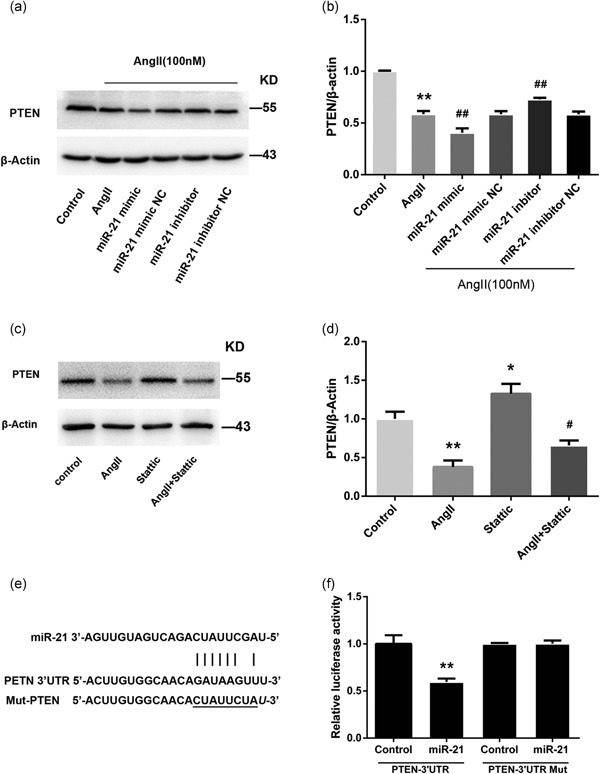
Figure 5.

miR‐21 reduces PTEN expression by directly targeting its 3′‐UTR. (a,b) Representative western blots and quantitative analysis showing PTEN protein levels after transfection with miR‐21 mimic (30 nM), miR‐21 inhibitor (100 nM), or negative control (n = 3). (c,d) The effect of the STAT3‐specific inhibitor (Stattic) on the protein expression level of PTEN was determined by western blotting (c), and band intensities were quantified by optical density scanning (n = 3) (d). (e) Schematic illustration of reporter plasmid construction containing full‐length 3′‐UTR of PTEN. (f) An miR‐21 mimic (30 nM) or negative control was cotransfected with the luciferase reporter vector into HEK293 cells. The relative luciferase activity is shown (n = 3). All data are presented as the mean ± standard deviation. *p < 0.05 vs. con. **p < 0.01 vs. con. # p < 0.05 vs. AngII. ## p < 0.01 vs. AngII. AngII: angiotensin II; miR‐21: miRNA‐21; PTEN: phosphatase and tensin homolog
