
Figure 7.
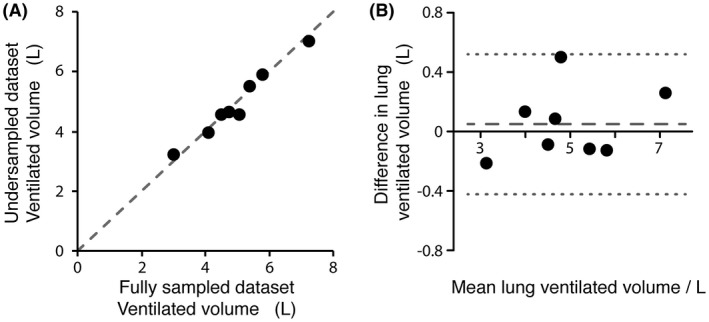
A, correlation and B, Bland‐Altman plots showing comparison of ventilated volumes measured calculated from fully sampled and 1.8× retrospectively undersampled datasets. The correlation plot shows an isoline between measurements. The calculated correlation coefficient was 0.982. The Bland‐Altman plot shows estimated bias (0.05 L, — — —) and 95% limits of agreement (±0.47 L, · · ·)