
Figure 2.
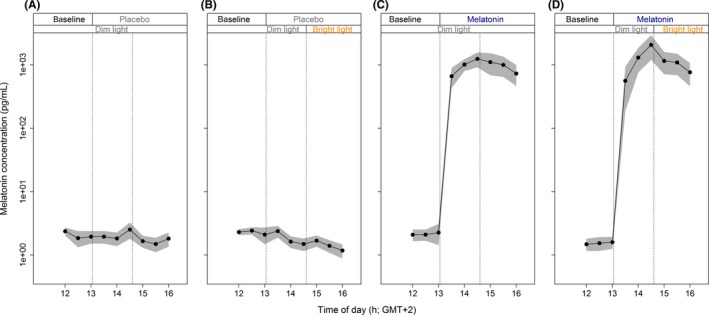
Time course of melatonin concentrations. Concentrations were determined by half‐hourly saliva samples, before and after placebo/melatonin administration. All data represent mean (black dots) ± standard error of the mean (gray), N = 10 per group