
Figure 4.
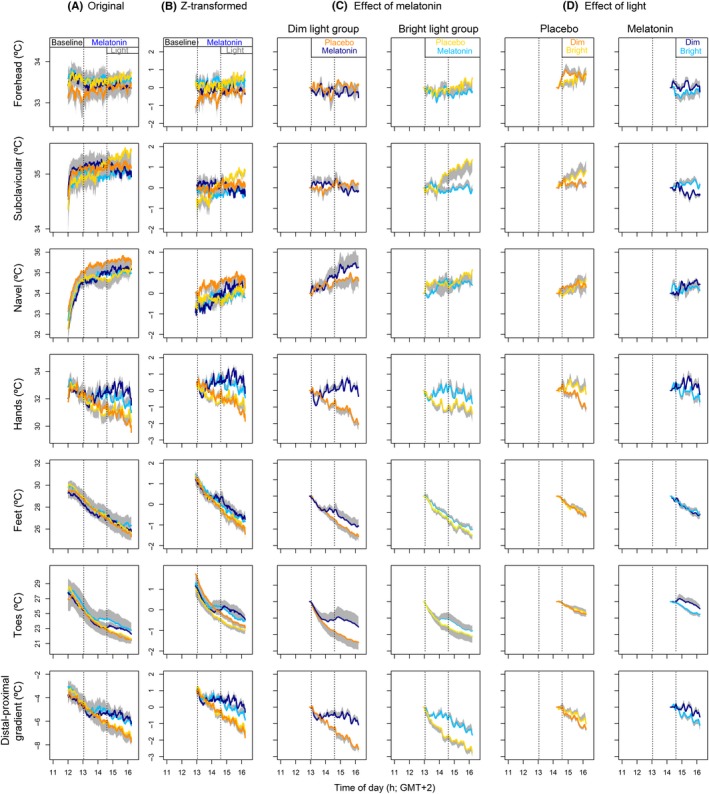
Effects of melatonin and light on skin temperatures. (A) Original data. (B) Z‐transformed data. (C) Effects of melatonin in the dim and bright light group. (D) Effects of light during the interval after placebo or melatonin administration. Data in C and D data are expressed relative to values at 13:00. E and F data are expressed relative to values at 14:30. DL data are depicted in orange (placebo) and dark blue (melatonin). BL data are in yellow (placebo) and light blue (melatonin). All data represent mean ± standard error of the mean, N = 10 per group, except for panel D, which includes N = 9 subjects