
Figure 1.
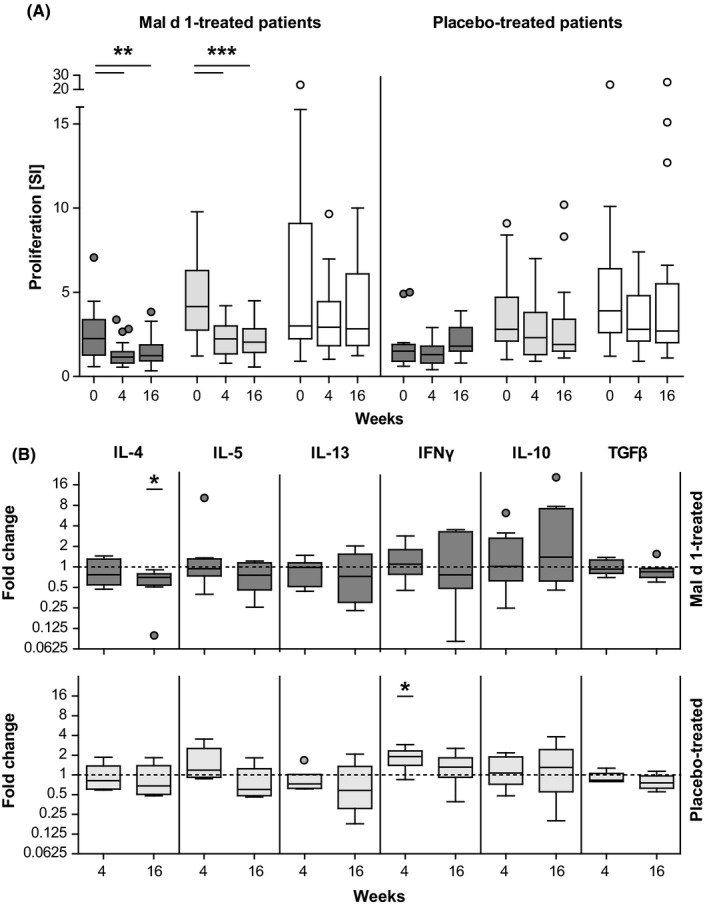
T‐cell responses to specific stimulation. A, PBMC collected from rMal d 1‐ (n = 20) and placebo‐treated (n = 19) individuals before (0), at 4 and 16 wk of treatment were stimulated with Mal d 1 (dark grey), rBet v 1 (light grey) or TT (white). 3[H]thymidine uptake was measured as counts per minute (cpm). Stimulation indices (SI) were calculated as the ratio of cpm in cultures plus antigen and cpm in cultures kept in medium alone. B, Relative mRNA expression of cytokines in rMal d 1‐stimulated CD3+ T cells isolated from rMal d 1‐treated individuals (n = 8) and individuals receiving placebo (n = 6) at 4 and 16 wk compared with values before treatment. Threshold cycle (Ct) values were determined; ΔΔCt values (housekeeping genes B2M and TBP) in relation to baseline calculated. Results are depicted as Tukey box plots, and outliers are shown as dots. (*P < 0.05, **P < 0.01, ***P < 0.001, repeated measures one‐way ANOVA with Tukey post hoc test)