Figure 3.

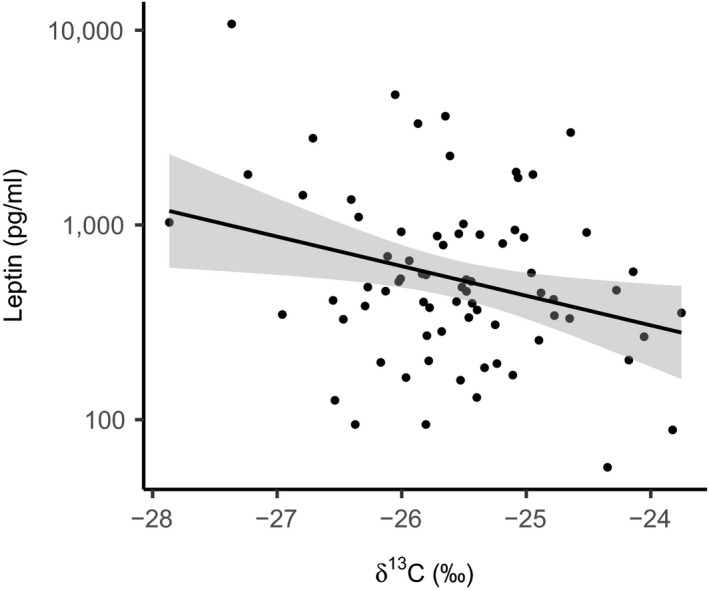
Variation in circulating leptin concentration with carbon isotope values. Points represent individual mice, and line shows model prediction with grey shading for ±SE

Variation in circulating leptin concentration with carbon isotope values. Points represent individual mice, and line shows model prediction with grey shading for ±SE