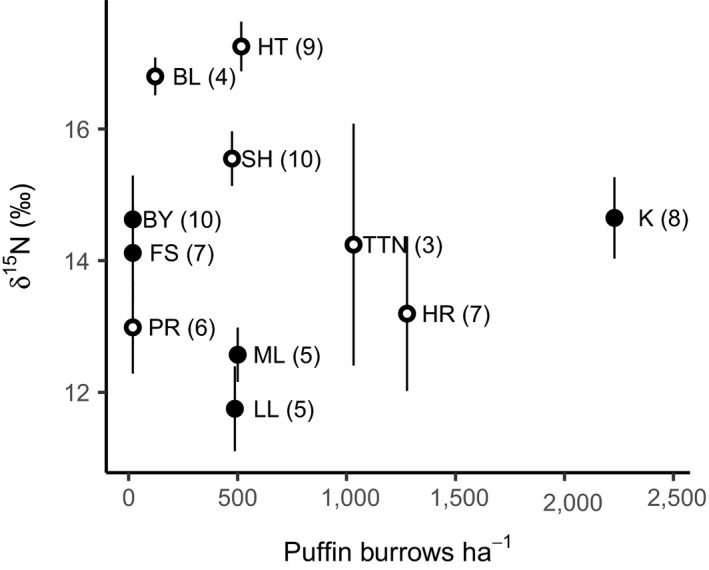
Figure 4.

Variation in mouse nitrogen isotope values among trapping locations. Points show the mean value for each of the 11 locations, and vertical lines show ±SE. Letter codes refer to the sampling locations detailed in Figure 1, with sample size in brackets. Also shown are the density of occupied puffin burrows (x‐axis) and the dominant vegetation type (Silene uniflora, open circles; Holcus lanatus, filled circles). Of the variables shown here, only location explained a significant proportion of variation in δ15N values
