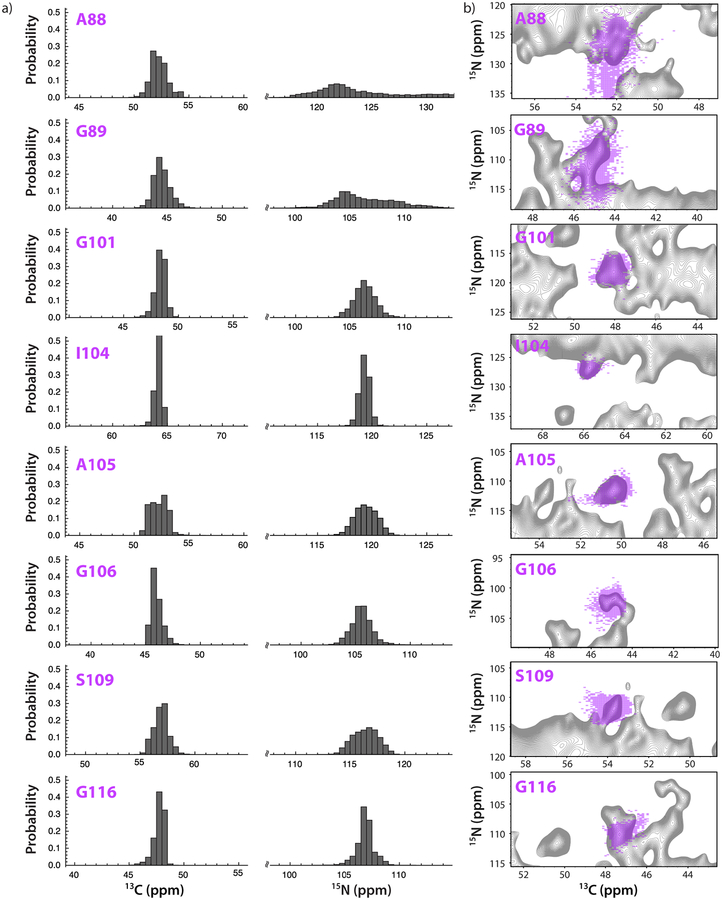
Figure 3.
a) The probability distributions of 13Cα and 15NH chemical shifts, calculated from 5000 substructures of the 100-ns MD trajectory for representative amino acids of HIV-1 CA. The range was set to ±8 ppm of the isotropic chemical shift to demonstrate the relative spread in chemical shift values. The isotropic chemical shifts were calculated using SHIFTX.61. b) Overlay of experimental contour plots (light pink) for well-resolved signals in the DNP-enhanced 15N-13C 2D NCACX correlation spectrum and chemical shift distribution maps for the corresponding residues (grey) of of U-13C, 15N HIV-1 CA tubular assembly, calculated from 5000 substructures of 100 ns MD trajectories. Experimental conditions are the same as in Fig. 2.

