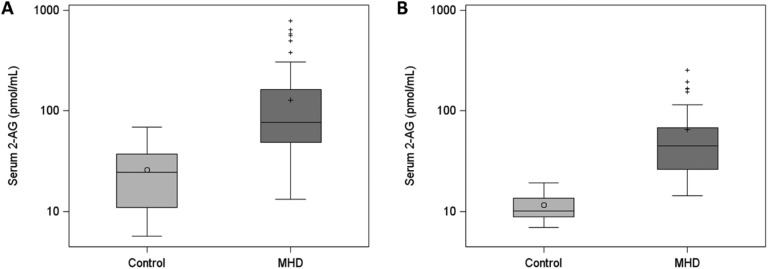
Figure 1.
First and confirmatory analyses of serum 2-AG concentrations in patients receiving MHD compared with control subjects. (A) Serum 2-AG concentrations in the first analysis of 96 MHD patients and 21 control subjects. (B) Serum 2-AG concentrations in the confirmatory analysis of 37 MHD patients and 10 control subjects. Serum 2-AG levels are presented on a logarithmic scale for visual purposes only. P < 0.0001 for both, Wilcoxon‒Mann-Whitney U test. Horizontal lines in boxplots represent the median, circle and cross in boxplots represent the mean in the control and MHD groups, respectively, error bars represent the lower (25th percentile - 1.5*IQR) and upper (75th percentile + 1.5*IQR) boundaries, and crosses outside boxplots represent outliers.

