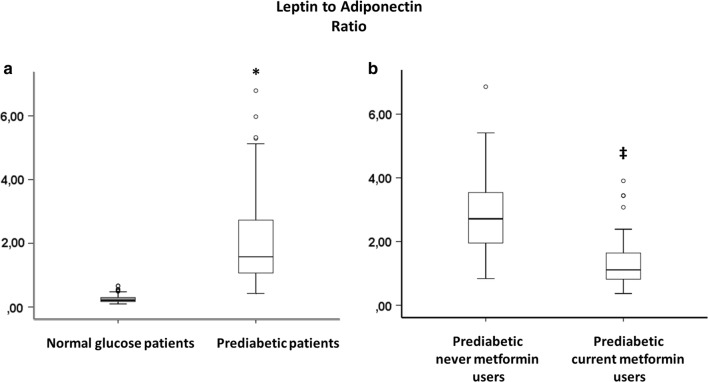
Fig. 2.
a Leptin to adiponectin ratio, in pericoronary fat specimens from 180 normal glucose patients and 180 prediabetic patients matched with propensity score analysis (PSM). (Boxplot, a plot type that displays the median, 25th, and 75th percentiles and range). *P < 0.01 vs. normal glucose patients. b Leptin to adiponectin ratio, in pericoronary fat specimens from 58 prediabetic never metformin users, and 58 prediabetic metformin users. ‡P < 0.01 vs. never metformin users. Data are mean ± SD

