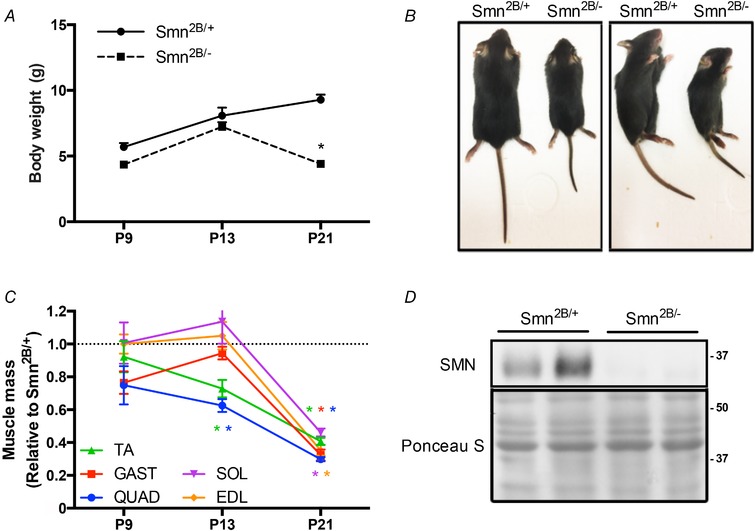
Figure 1. Characterization of Smn2B/− mice during disease progression.

A, body mass of Smn2B/+ and Smn2B/− mice at postnatal day (P) 9, P13 and P21. B, Smn2B/+ and Smn2B/− mice in prone (left) and side‐lying (right) positions. C, mass of the tibialis anterior (TA; green), gastrocnemius (GAST; red), quadriceps (QUAD, blue), soleus (SOL, purple), and extensor digitorum longus (EDL, orange) muscles from Smn2B/− mice displayed relative to Smn2B/+ littermates. D, representative western blot of survival motor neuron (SMN) protein in QUAD muscles of Smn2B/+ and Smn2B/− mice. A Ponceau S stain is displayed below to indicate equal loading between samples. Protein ladder markers are expressed as kDa. * P < 0.05 vs. age‐matched Smn2B/+; n = 10. [Color figure can be viewed at wileyonlinelibrary.com]
