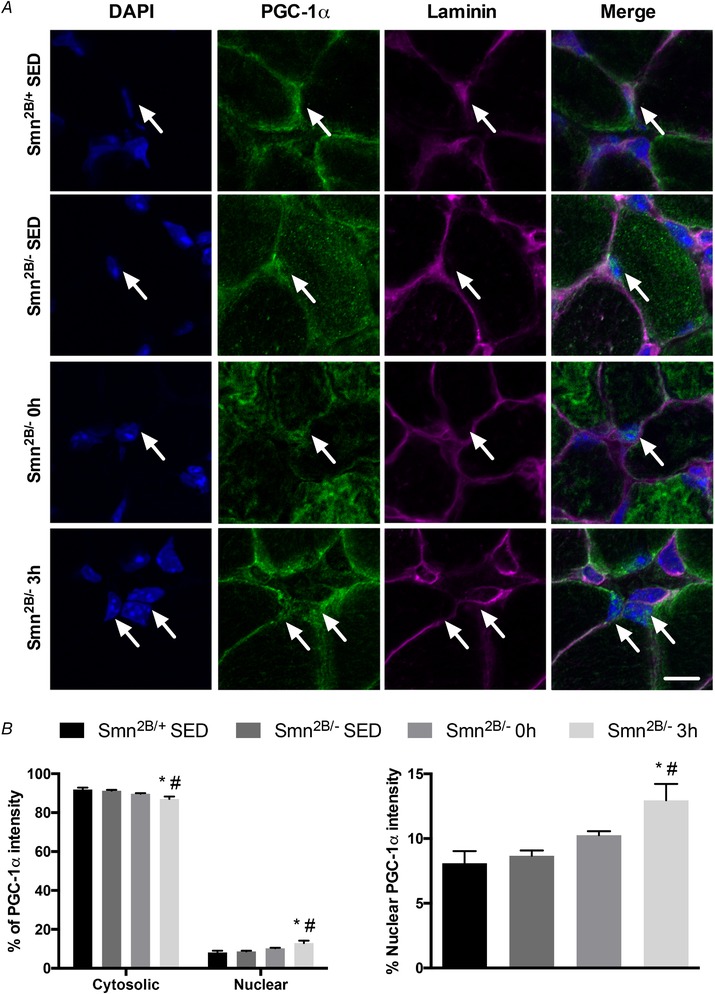
Figure 5. Subcellular localization of PGC‐1α in the muscle of exercised SMA‐like mice.

A, immunofluorescence images of PGC‐1α in SOL muscles of Smn2B/+ SED, Smn2B/− SED, Smn2B/− 0 h and Smn2B/− 3 h mice. DAPI denotes myonuclei while laminin marks the sacrolemma. The PGC‐1α column displays representative, confocal immunofluorescence images from the four experimental cohorts. The merged images show the overlay of the four channels. White arrows denote PGC‐1α‐positive myonuclei. The scale bar represents 5 µm. B, left, graphical summary of PGC‐1α subcellular localization in cytosolic and nuclear compartments of SOL muscles from the four experimental groups. B, right, enlarged summary of the percentage nuclear accumulation of PGC‐1α from B, left. * P < 0.05 vs. Smn2B/+ SED; # P < 0.05 vs. Smn2B/− SED; n = 7. [Color figure can be viewed at wileyonlinelibrary.com]
