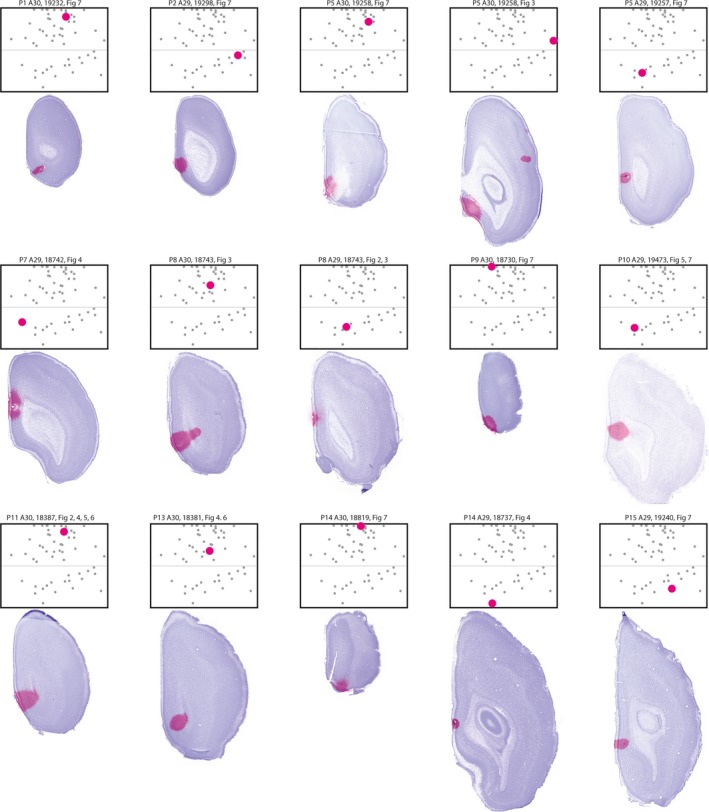
Figure 2.

Injections used in figures. Images of the section containing the center of the injection overlaid on the image of the neighboring Nissl‐stained section are shown together with the flatmaps indicating the normalized position of the respective injection (large dot). Smaller dots depict the normalized position of other injections used for analysis. Heading depicts age of the animal at perfusion, area injected, animal identity, and in which figure retrogradely labeled neurons of the injection were displayed. [Colour figure can be viewed at wileyonlinelibrary.com]
