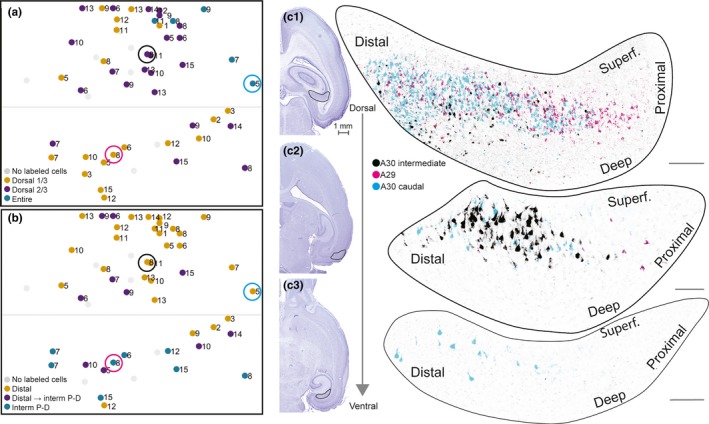
Figure 4.

Labeled neurons in SUB. (a) Normalized flatmap of RSC illustrating the dorsoventral organization of the origin in SUB of projections to RSC. Injections resulting in retrogradely labeled neurons in the dorsal one‐third of SUB (yellow dots), the dorsal two‐thirds of SUB (purple dots), and the entire SUB (green dots). Gray dots depict injections not resulting in labeled neurons in SUB. Injections in the caudal A30 resulted in retrogradely labeled neurons in the entire SUB, whereas progressively more rostral and ventral injections resulted in retrogradely labeled neurons in more dorsal parts of SUB. (b) Normalized flatmap of RSC illustrating the proximodistal organization of the origin in SUB of projections to RSC. Injections were color‐coded based on the distribution of the retrogradely labeled neurons: in the distal one‐third of SUB (yellow dots), in distal SUB dorsally and progressively more proximal SUB at more ventral levels (purple dots), and in intermediate proximodistal SUB (green dots). Gray dots depict injections not resulting in labeled neurons within SUB. Injections in dorsal RSC resulted in retrogradely labeled neurons in distal SUB and progressively more ventral injections resulted in retrogradely labeled neurons in more proximal parts of SUB. (c) Representative examples of the distribution of retrogradely labeled neurons shown in three horizontal sections (c1–c3), taken at different dorsoventral levels after three injections. The distributions of the three cases were merged into one representation in order to illustrate the complex topography along the dorsoventral and proximodistal axes of the subiculum. Retrogradely labeled neurons after a caudal injection in A30 (cyan, 19258 P5, FB), an intermediate rostrocaudal A30 injection (black, 18743 P8, FB), and a ventral and more rostral A29 injection (magenta, 18743 P8, DiI). Circles in (a) and (b) depict the location of each injection in RSC. High‐power images (right) of dorsal (top) and more ventral levels of SUB (bottom) are shown. Black contours in adjacent Nissl‐stained sections (left) depict location of high‐power images. Injections in A30 resulted in retrogradely labeled neurons in distal SUB (cyan and black), whereas injections in A29 resulted in retrogradely labeled neurons in more proximal SUB (magenta). Injections in caudal A30 (cyan) resulted in retrogradely labeled neurons along most of the dorsoventral level of distal SUB, whereas rostral injections resulted in labeled neurons in only the dorsal SUB (magenta and black). Scale bar: 100 μm. [Colour figure can be viewed at wileyonlinelibrary.com]
