Figure 6.

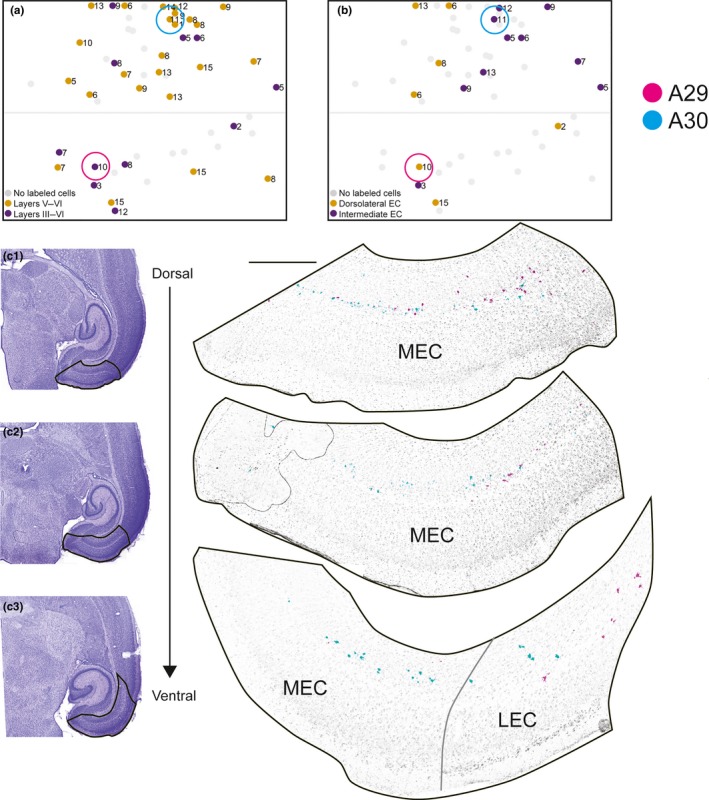
Labeled neurons in entorhinal cortex. (a) Normalized flatmap of RSC illustrating the superficial‐to‐deep organization of origin of RSC projections in EC. Injections were color‐coded based on the distribution of the retrogradely labeled neurons: injections resulting in retrogradely labeled neurons in layers V and VI of entorhinal cortex (orange dots), and both layers V–VI and layer III of entorhinal cortex (purple dots). Gray dots depict injections resulting in no retrogradely labeled neurons in entorhinal cortex. (b) Normalized flatmap of RSC illustrating the mediolateral organization of origin in EC. Injections were color‐coded based on the distribution of the retrogradely labeled neurons: injections resulting in retrogradely labeled neurons in dorsolateral EC (yellow dots) and intermediate dorsolateral‐ventromedial EC (purple dots). Gray dots depict injections resulting in no clear dorsolateral‐ventromedial organization of retrogradely labeled neurons in EC or injections with no retrogradely labeled neurons observed in EC. Injections resulting in retrogradely labeled cells in intermediate dorsolateral‐ventromedial EC were located mainly in caudal A30, whereas caudal A30 received projections from dorsolateral EC. Color‐coded circles in A, B depict the location of injections in RSC, shown in figure (c). (c) Representative examples of the distribution of retrogradely labeled neurons shown in three horizontal sections (c1–c3), taken at different dorsoventral levels after two FB injections in RSC. The distributions of the two cases were merged into one representation to illustrate the complex topography along the dorsomedial to ventrolateral axes of entorhinal cortex. The injections were located in A29 (magenta, 19473 P10) and A30 (cyan, 18387 P11). Circles in A and B depict location of each injection in RSC. High‐power images (right) of dorsal (top) and more ventral levels of SUB (bottom) are shown. Black contours in adjacent Nissl‐stained sections (left) depict location of high‐power images. The injection in A30 resulted in retrogradely labeled cells in intermediate dorsolateral‐ventromedial EC (cyan), whereas the injection in A29 result in retrogradely labeled cells in the dorsolateral EC. Scale bar: 500 μm. [Colour figure can be viewed at wileyonlinelibrary.com]
