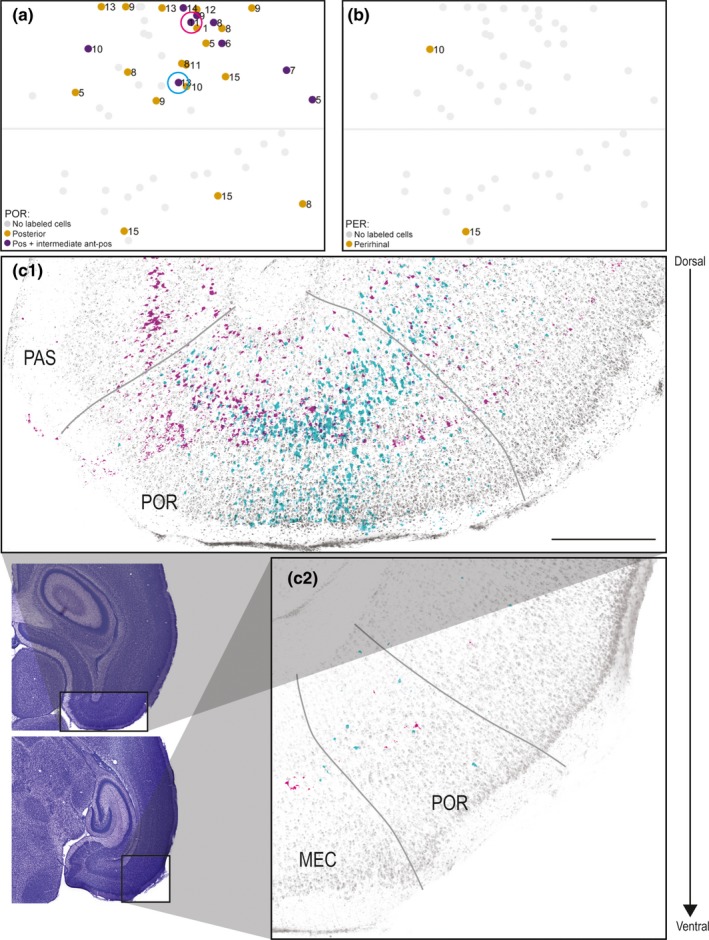
Figure 7.

Labeled neurons in POR and PER. (a) Normalized flatmap of RSC illustrating the anteroposterior organization of origin of RSC projections in POR. Indicated are injections resulting in retrogradely labeled neurons in posterior POR (yellow dots) and intermediate anterioposterior POR (purple dots). Gray dots depict injections resulting in no retrogradely labeled neurons in POR. Most of the injections resulting in retrogradely labeled cells in POR were located in A30. Color‐coded circles in A depict the location of injections in RSC, shown in figure (c). (b) Normalized flatmap of RSC illustrating the origin in PER of projections to RSC. Indicated are injections resulting in retrogradely labeled neurons in PER (yellow dots). Gray dots depict injections resulting in no retrogradely labeled neurons in PER. (c) Representative examples of the distribution of retrogradely labeled neurons shown in two horizontal sections, taken at different dorsoventral levels after two FB injections in A30 (cyan, 18381 P13 and magenta, 18387 P11). Representative examples of retrogradely labeled neurons were overlaid on a Nissl section from two posterior to anterior levels of POR (c1 and c2). Circles in A depict the locations of the two injections in RSC. Black contours in adjacent Nissl‐stained sections depict location of high‐power images. Both of the injections resulted in retrogradely labeled cells in deep and superficial layers of POR. In both examples, most of the retrogradely labeled neurons were located in posterior POR (c1), whereas at more anterior levels fewer labeled neurons were visible (c2). Scale bar: 500 μm. [Colour figure can be viewed at wileyonlinelibrary.com]
