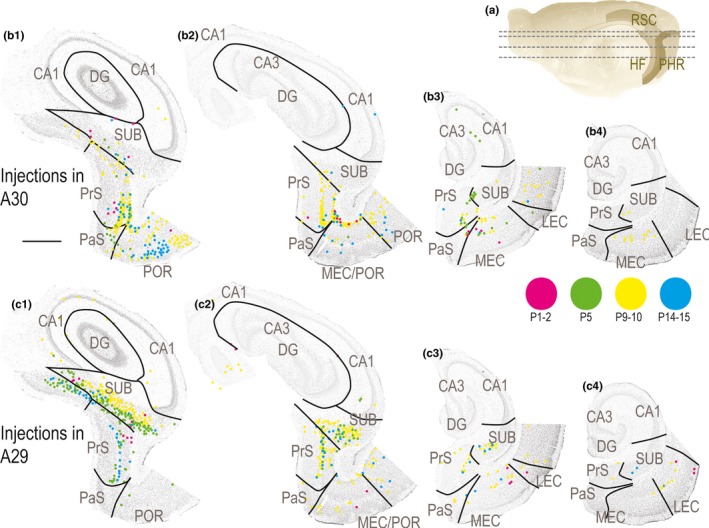
Figure 8.

Development of HF‐PHR projections to RSC. (a) Midsagittal view of the rat right hemisphere. Gray lines depict dorsoventral levels of sections in (b) and (c). (b) Retrogradely labeled cells in HF‐PHR after injections in A30. Each dot represents one retrogradely labeled cell and is plotted on Nissl‐stained sections from four dorsal (left) to ventral levels of HF‐PHR (right). Magenta dots represent labeled neurons in a P1 animal (19232 DiI), green dots in a P5 animal (19258 DiI), yellow dots in a P9 animal (18730 FB), and cyan dots in case of a P14 animal (18819 DiI). At all ages, the retrogradely labeled neurons were mainly located in distal SUB, distal PrS, and medial MEC. At the youngest ages (magenta), only a few labeled neurons were seen, whereas in the older ages, a higher number of labeled cells was present. Scale bar: 1,000 μm. (c) Retrogradely labeled cells in HF‐PHR after injections in A29. Panels are organized similar to B. Magenta dots represent labeled neurons in a P2 animal (19298 FB), green dots in a P5 animal (19257 FB), yellow dots in a P10 animal (19473 FB), and cyan dots in case of a P15 animal (19240 FB). At all ages, the retrogradely labeled neurons were mainly located in more proximal parts of SUB compared to after A30 injections, proximal PrS and lateral MEC. At the youngest ages (magenta), only a few labeled neurons were seen, whereas in the older ages, a higher number of labeled cells were present. [Colour figure can be viewed at wileyonlinelibrary.com]
