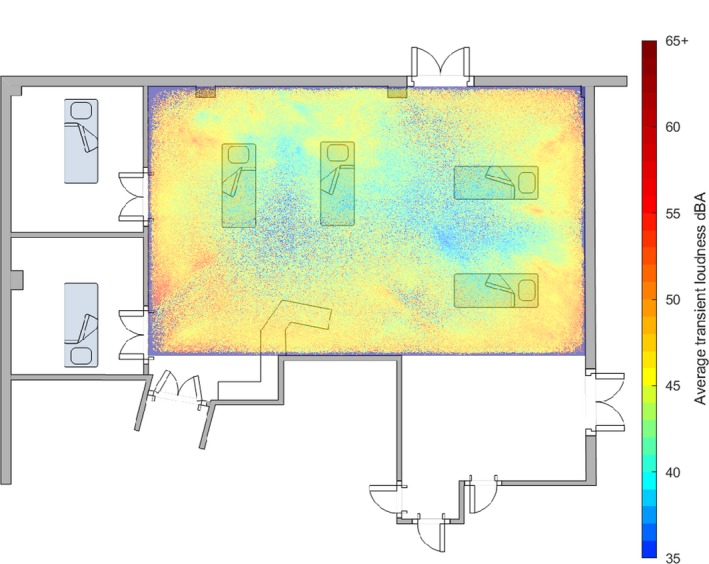
Figure 2.

A heat map of the average loudness of noises above 35 dB originated from each 1 cm2 of the intensive care unit bay for the 249‐day study period, superimposed on a floor plan of the bay. The position and identifier for each of the four beds and the work bench in the bay is shown.
