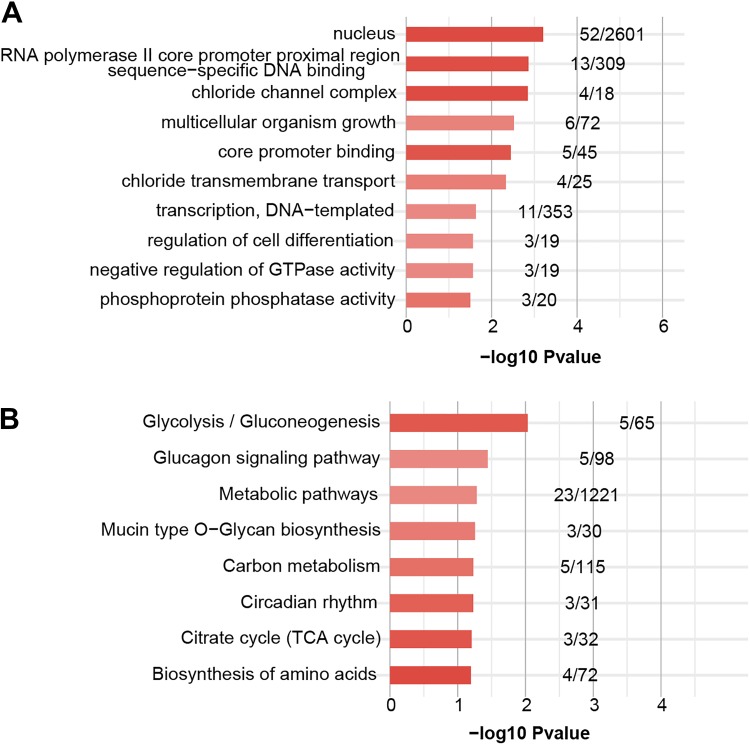
Figure 3.
Functional analysis of miR-122 target genes. (A) The top 10 enriched GO terms for target genes of miR-122. (B) The top 10 enriched KEGG pathways for target genes of miR-122. The X-axis number represents the enriched P value of each GO term or KEGG pathway. The numbers of each bar represent the target or background gene number of each term or pathway.

