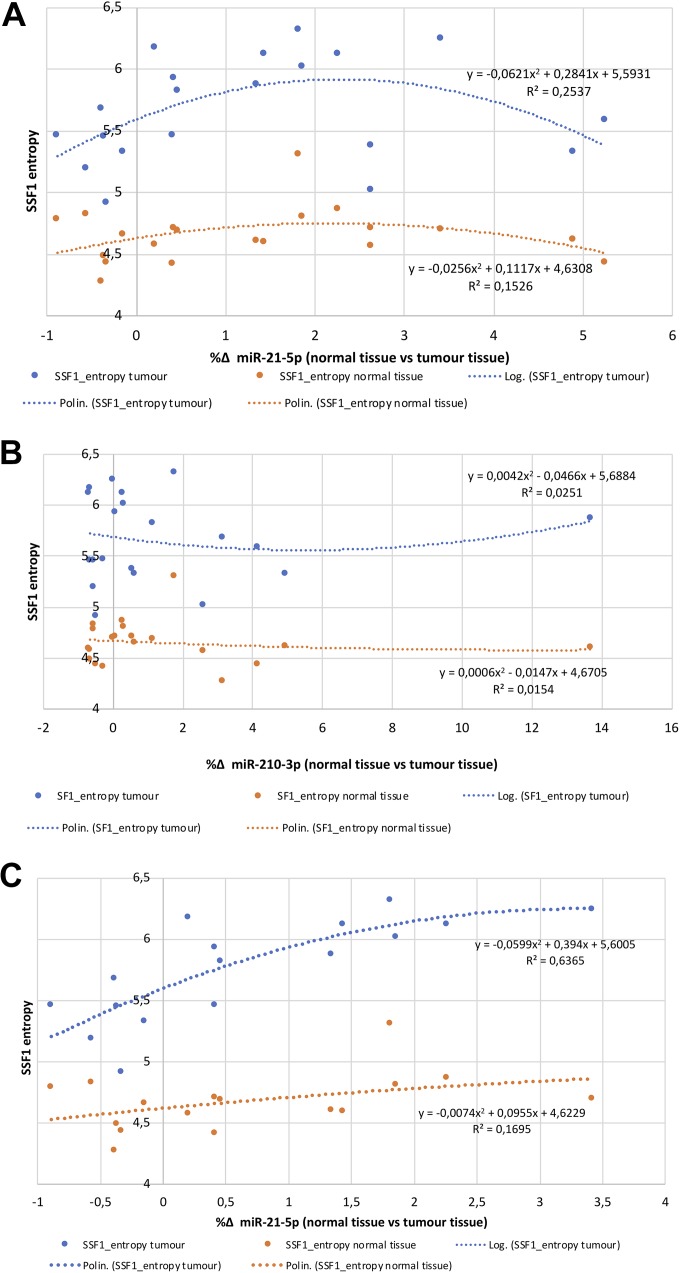
Figure 3.
Graphics of relation and R2 value between microRNAs and CTTA features in ccRCC. A, Comparison between miR-21-5p (expressed as %Δ normal vs tumor) and tissue entropy (SSF1). B, Comparison between miR-210-3p (expressed as %Δ normal vs tumor) and tissue entropy (SSF1). C, Comparison between miR-21-5p (expressed as %Δ normal vs tumor) and tissue entropy excluding 4 patients with extremely overexpressed miR-21-5p in tumor samples (too far from median values). ccRCC indicates clear cell renal cell carcinoma; CECT, contrast-enhanced computed tomography; CTTA, computed tomography texture analysis; SSF, spatial scaling factor.

