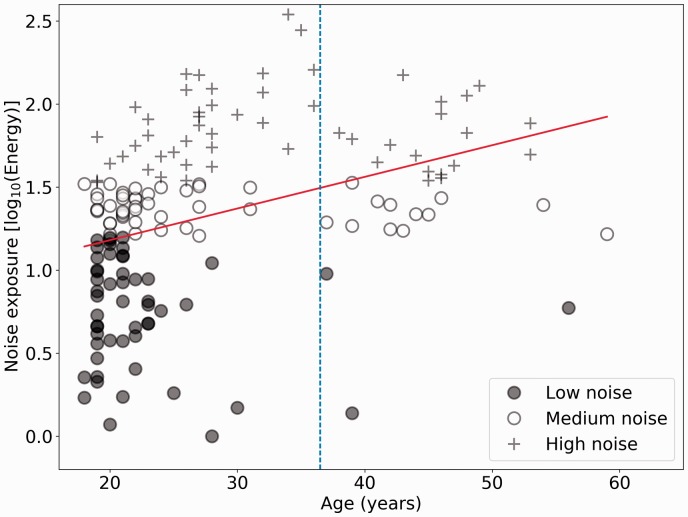
Figure 1.
Noise exposure scores as a function of age for 156 participants. The least squares regression line is also shown in red. The lower, middle, and upper thirds of the noise exposure cohort are plotted in different symbols. The age cutoff for the two cohorts is shown by the dashed vertical line.

