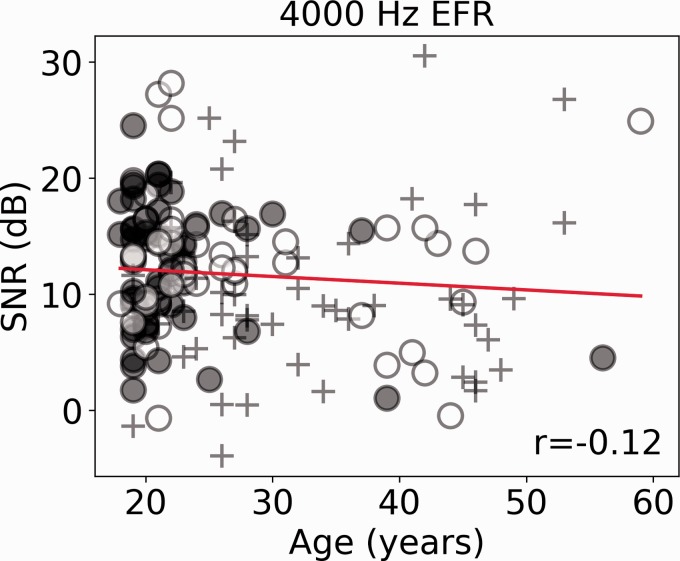
Figure 4.
The EFR response is plotted as a function of age. Solid (red) lines show the linear regression line, and the different thirds of the noise exposure cohort are plotted in different symbols. The Spearman correlation coefficient is reported.
SNR = signal-to-noise ratio; EFR = envelope-following response.

