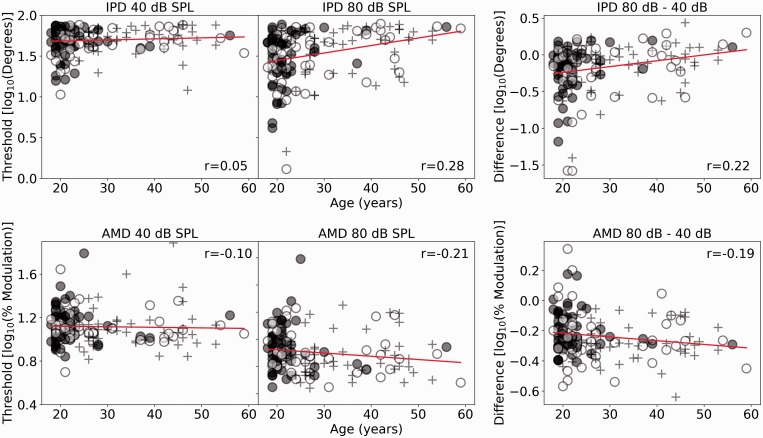
Figure 5.
The upper row shows IPD responses, and the lower row shows AMD response. For both rows, 40 dB SPL, 80 dB SPL, and the differential measures are plotted as a function of age in the left, central, and right panels, respectively. Solid (red) lines show linear regressions. Spearman correlation coefficients are reported.
IPD = interaural phase difference; SPL = sound pressure level; AMD = amplitude modulation detection.

