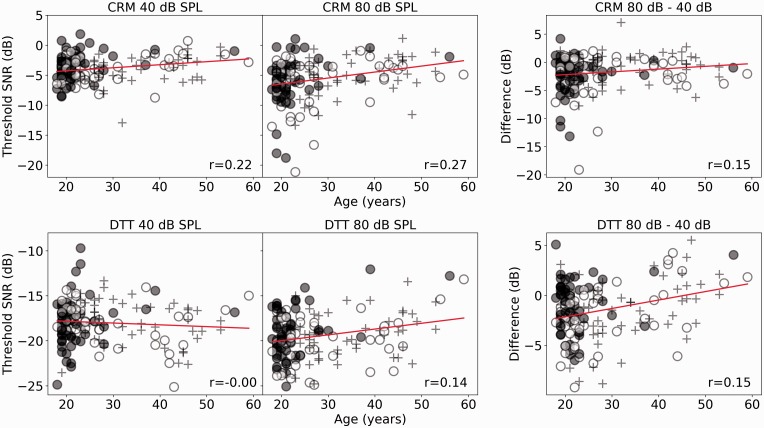
Figure 6.
The upper row shows SNRs corresponding to the 25% correct-response criterion for the CRM task, and the lower row shows SNRs corresponding to the 25% correct-response criterion for the DTT task. For both rows, the 40 dB, 80 dB, and the differential measures are plotted as a function of age in the left, central, and right panels, respectively. Solid (red) lines show linear regressions. Spearman correlation coefficients are reported.
CRM = co-ordinate response measure; SPL = sound pressure level; DTT = digit triplet test; SNR = signal-to-noise ratio.

