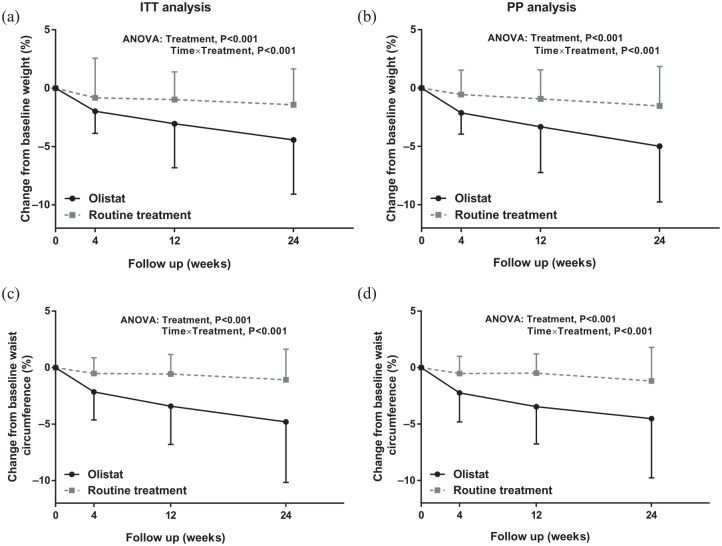
Figure 4.
Body mass index (a) and waist circumference (c) at baseline and after 1, 3 and 6 months of treatment with orlistat or routine treatment in the ITT analysis. Body mass index (b) and waist circumference (d) at baseline and after 1, 3 and 6 months of treatment with orlistat or routine treatment in the PP analysis. Bars show the mean, and error bars represent standard deviations of relative reduction to baseline. Data points in each group with repeated measures at each time point are shown with an interconnecting line.
ANOVA, analysis of variance; ITT, intention-to treat; PP, per protocol.

