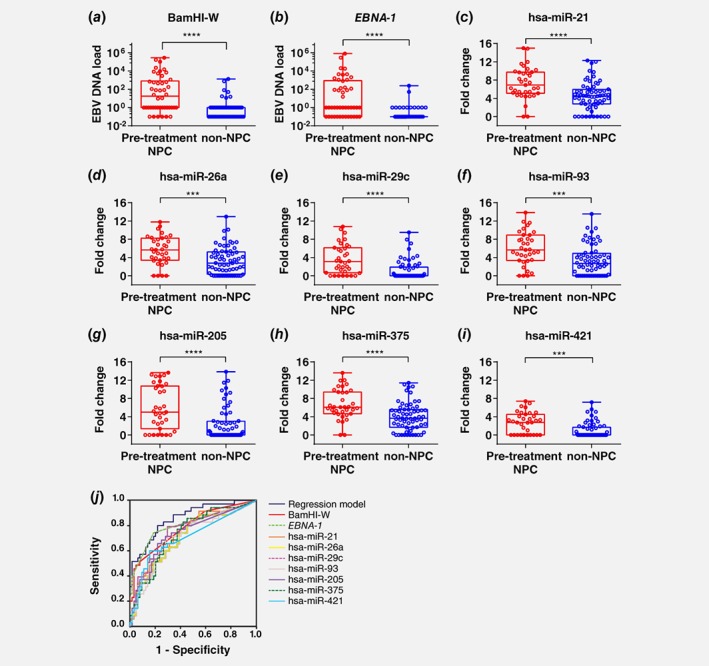
Figure 2.

EBV DNA load and differentially expressed miRNAs in nasal washings. EBV DNA load measured by (a) BamHI‐W and (b) EBNA‐1 were significantly different between pre‐treatment NPC samples (n = 46) and non‐NPC samples (n = 73) (Mann–Whitney test, **** p ≤ 0.0001). EBV DNA load was set as 0.1 (arbitrary value) for samples below detection limit (Cq > 40) and 1 to indicate samples that were weak positive. (c) hsa‐miR‐21, (d) hsa‐miR‐26b, (e) hsa‐miR‐29c, (f) hsa‐miR‐93, (g) hsa‐miR‐205, (h) hsa‐miR‐375 and (i) hsa‐miR‐421 in nasal washings of pre‐treatment NPC (n = 35) and non‐NPC (n = 64) samples were significantly different (Mann Whitney test, *** p ≤ 0.001; **** p ≤ 0.0001). (j) Receiver operating characteristics curve discriminating pre‐treatment NPC from non‐NPC. Area under curve for all markers are above 0.7 as shown in Supporting Information Table S4. [Color figure can be viewed at wileyonlinelibrary.com]
