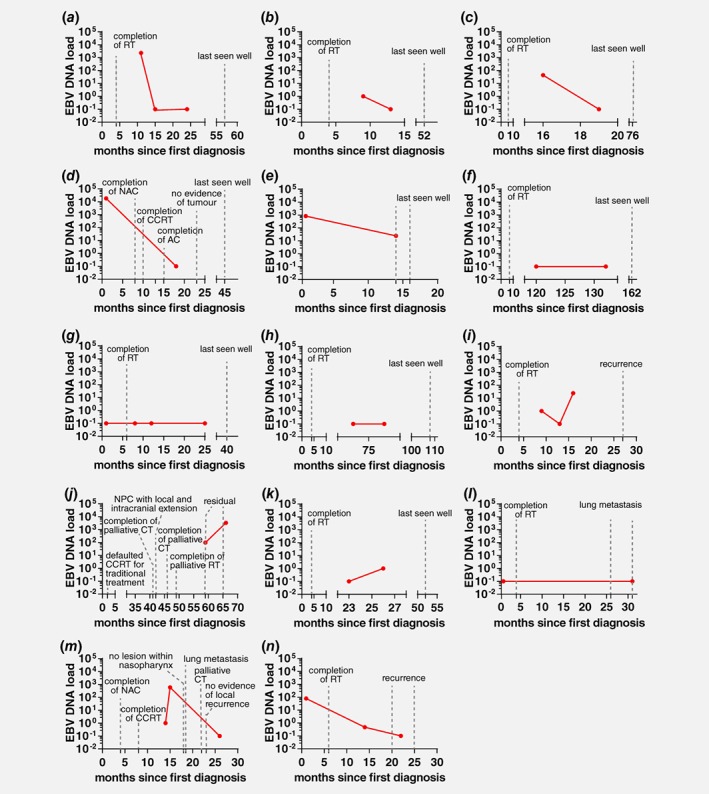
Figure 3.

EBV DNA load in nasal washings of NPC patients collected at multiple time points. Each graph represents the trend of NW EBV DNA load (measured by EBNA‐1 assay) for one patient. Each dot represents NW EBV DNA load at the indicated time point. (a)–(h) Patients were last known to be well and had decreasing or undetectable NW EBV DNA load after treatment. (i) and (j) Increasing NW EBV DNA load in patients with recurrence/residual NPC. (k) Undetectable and weak positive NW EBV DNA load in complete remission patient. (l)–(n) Undetectable or decreasing NW EBV DNA load in patients with lung metastasis or recurrence. RT, radiotherapy; NAC, neoadjuvant chemotherapy; AC, adjuvant chemotherapy; CCRT, concurrent chemo‐radiotherapy; CT, chemotherapy. [Color figure can be viewed at wileyonlinelibrary.com]
