Fig 1.

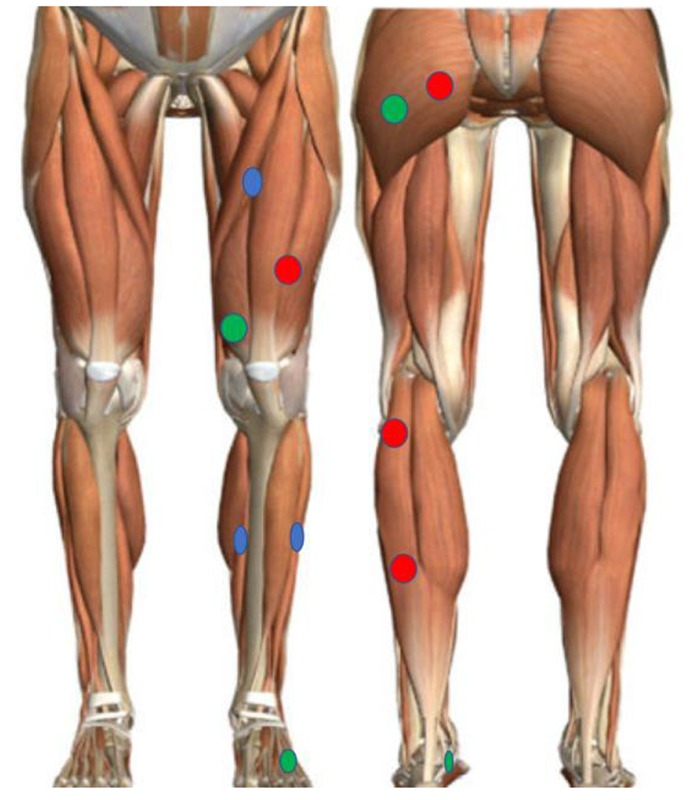
Visual representation of the points selected for the first session (red), second session (green) and third session (blue).

Visual representation of the points selected for the first session (red), second session (green) and third session (blue).