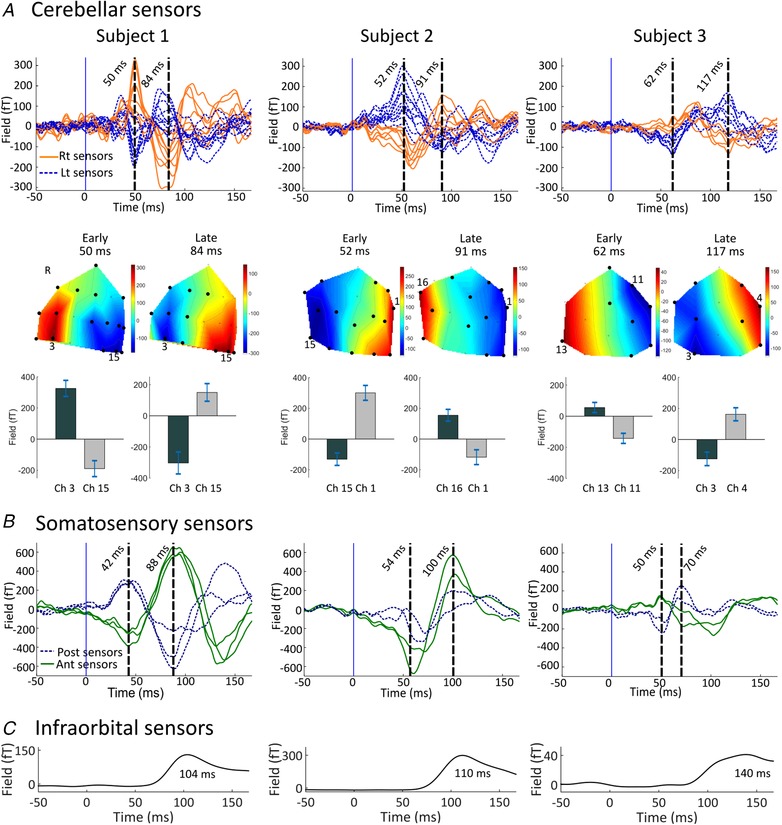
Figure 2. Sensor‐level evoked and blink responses following air‐puff stimulation.

A, upper panel: air‐puff evoked responses over the cerebellar sensor array for 3 subjects. Each trace corresponds to the average signal for one sensor over the posterior cranium, situated left (blue dotted curves) and right (orange continuous curves) of the midline respectively. Middle panel: field maps of the evoked field at the latencies of the two distinct peaks. On the field maps, all sensors at which the response was statistically significant are displayed (black circles). Statistical significance was assessed with paired t test comparing mean amplitudes between peak latency ±2 ms and baseline (−4 ms to 0 ms relative to air‐puff contact, P < 0.05). The positions of the sensors with the highest activity are highlighted with their channel numbers. Note different sensor layout for each subject. Lower panel: the bar graphs and error bars display the mean field strengths and 95% confidence intervals of the early and late peaks. For each response, the two sensors showing the highest positive and negative activity are displayed. B, sensor‐level evoked responses over the right (i.e. contralateral) somatosensory area (anterior and posterior sensors as green continuous and blue dashed curves, respectively). C, the average blink waveform obtained from the infra‐orbital sensor, constituting of a single component peaking later than 100 ms. Note the time courses of somatosensory and infraorbital waveforms are distinctly different from those observed at posterior sensors.
