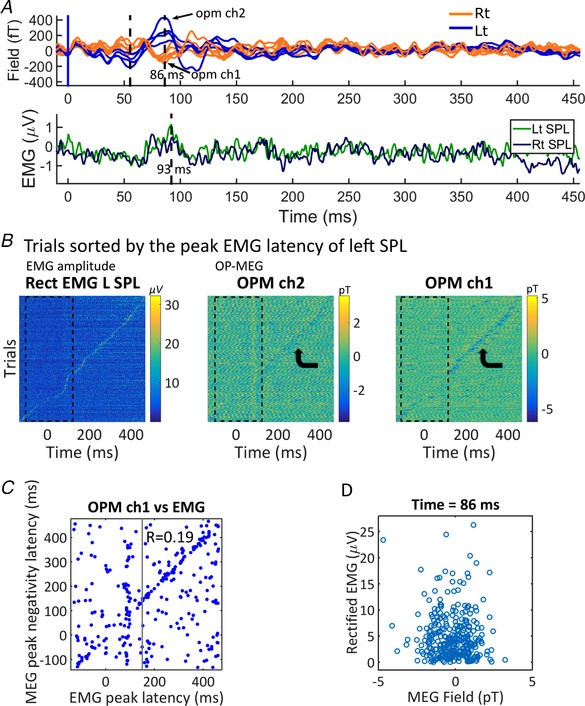
Figure 3. Comparing cerebellar MEG evoked responses with neck EMG data.

A, comparison of the average posterior waveforms (upper) and rectified EMG (lower) of subject 3: on average, EMG activity peaks (93 ms) later than the evoked responses of OP‐MEG, though close to the late component (86 ms). Note that the OP‐MEG evoked responses appear before 150 ms. B, EMG and OP‐MEG trials sorted by the latency of peak EMG activation, subject 3. The colour scale represents the amplitude of EMG and OP‐MEG. Peak EMG latencies (left panel) were approximately uniformly distributed across the epoch. Although the MEG negativity peak seems to temporally correlate with the peak EMG in some sensors (6 out of 11, 2 examples shown here), this correspondence is only observable outside the time window of evoked responses (i.e. before air‐puff stimulation and after 150 ms, see bent arrows). C, we performed correlation of latencies separately on trials with EMG peaking before and after 150 ms. Pearson's r for trials with EMG peaking before 150 ms (i.e. within the time window of evoked responses) is not significant (r = 0.12, P = 0.16). For trials peaking after 150 ms, there is a weak but significant correlation (r = 0.19, P = 0.01). D, there is no correlation between rectified EMG and OP‐MEG amplitude (OPM ch1) at the time of late MEG peak (r = −0.06, P = 0.30). [Color figure can be viewed at wileyonlinelibrary.com]
