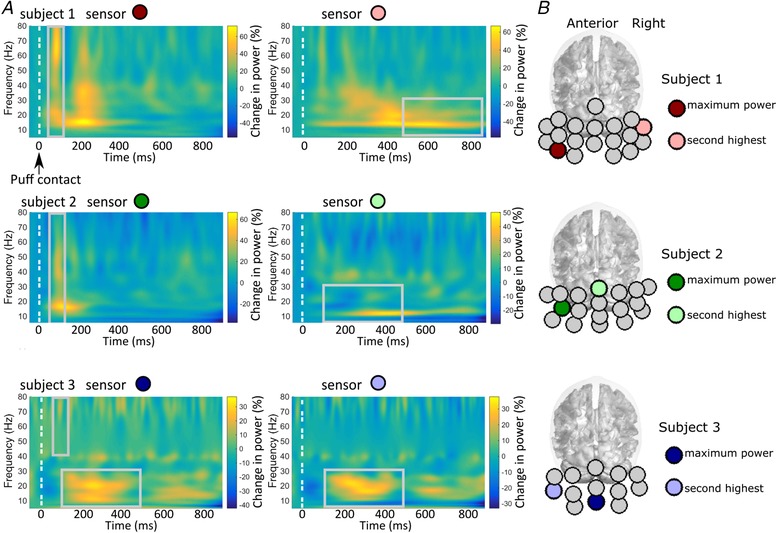
Figure 4. Time–frequency spectrograms showing induced power changes to air‐puff stimulation.

A, each subject's average across all trials at the two sensors with the maximal power changes. B, the positions of these sensors marked as coloured circles for each subject and mapped onto the Montreal Neurological Institute (MNI) template brain. Two types of enhanced activity can be observed: (1) a transient broadband response peaking at ∼100 ms (left column) and (2) increased power at 10–30 Hz (alpha and beta range) occurring during a 100–900 ms time window with individual latency differences (right column).
