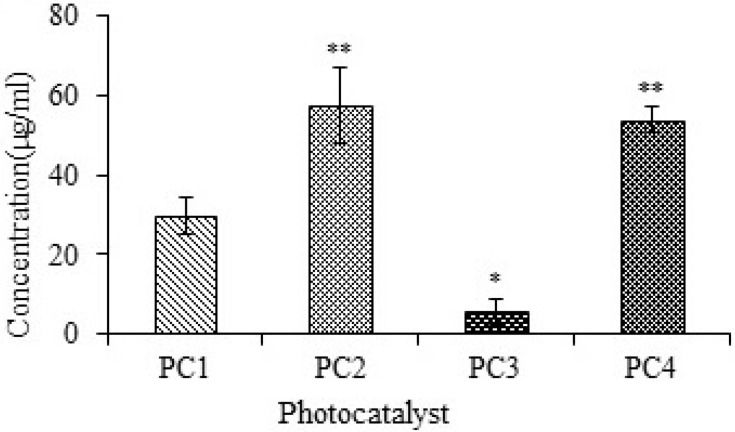
Figure 3.
Studies of brine shrimp lethality for PC1–PC4, given as LD50 values. Bars represent means ± standard deviations. Data were analyzed using Student’s t-test. *Represents a significant difference from the base line control group for p<0.05 and **Represents significant difference from the baseline control group for p<0.001 (n=5).

