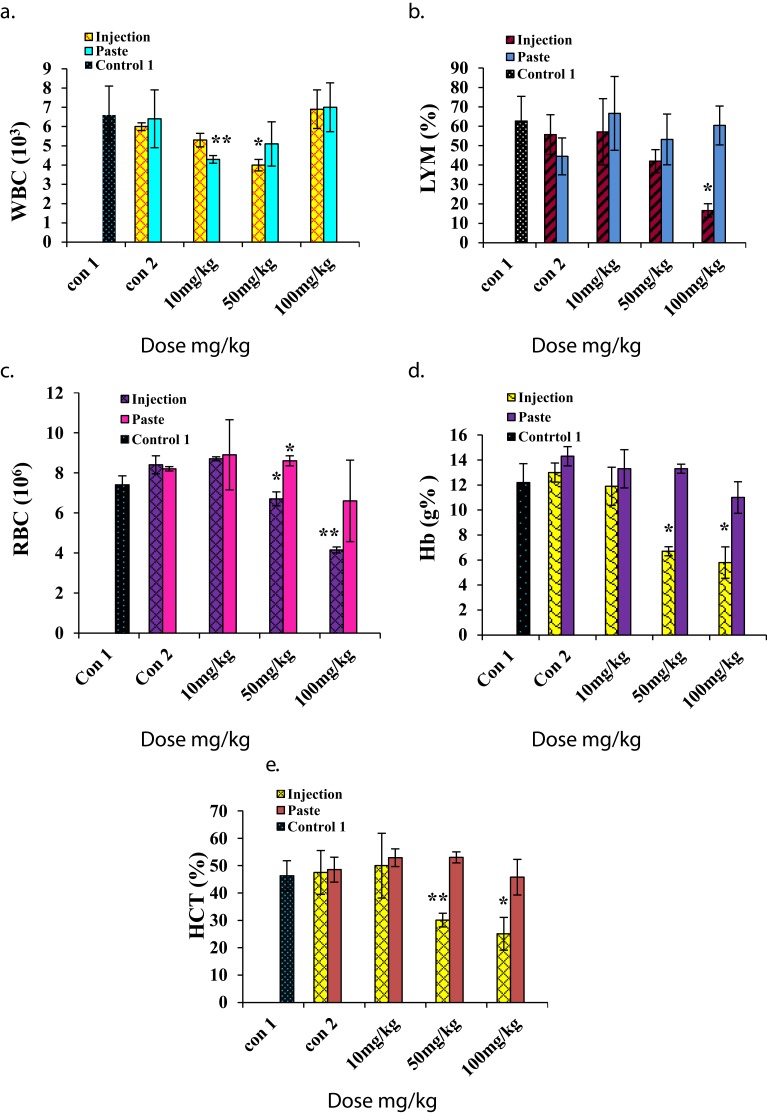
Figure 5.
Hematology results for mice treated with ZnO NPs and the two control groups (baseline and injection/paste) 14 days after intraperitoneal injection/topical paste at doses of 10, 50, and 100 mg/kg. These results show means and standard deviations for (A) white blood cells, (B) lymphocytes, (C) red blood cells, (D) hemoglobin, and (E) hematocrit. Bars represent means ± standard deviations. Data were analyzed using a t-test. *Represents a significant difference from the baseline control group for p<0.05, and **represents a significant difference from the baseline control group for p<0.001 (n=5).
Abbreviations: WBC, white blood cell; LYM, lymphocytes; RBC, red blood cell; Hb, hemoglobin; HCT, hematocrit.

