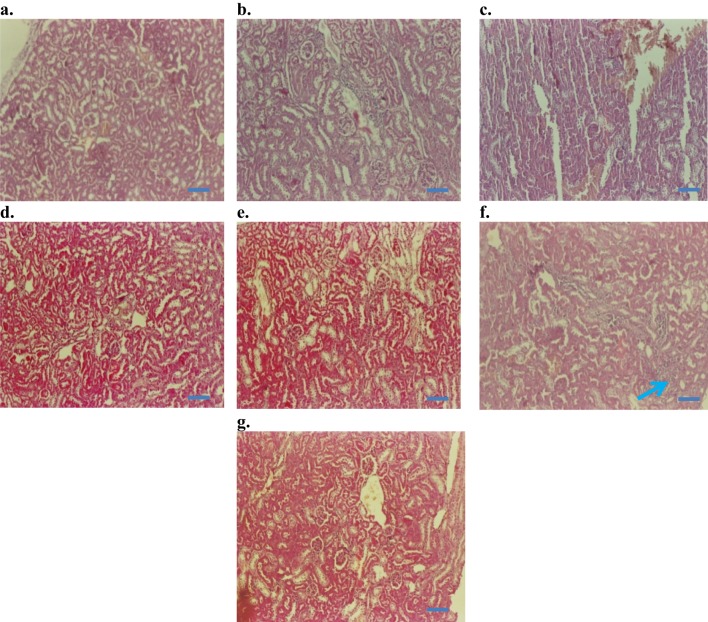
Figure 9.
Histopathology of kidney (H&E staining, 200×): (A) Control baseline, (B) control injection vehicle, (C) control paste vehicle, (D) i.p. at 10 mg/kg NP, (E) i.p. 50 mg/kg NP, (F) i.p.100 mg/kg NP, and (G) topical dose at 100 mg/kg NP.
Note: Arrow in (F) indicates mild inflammatory changes after 100 mg/kg NP dose, given as i.p. injection for 14 days. Bars 50 µm.

