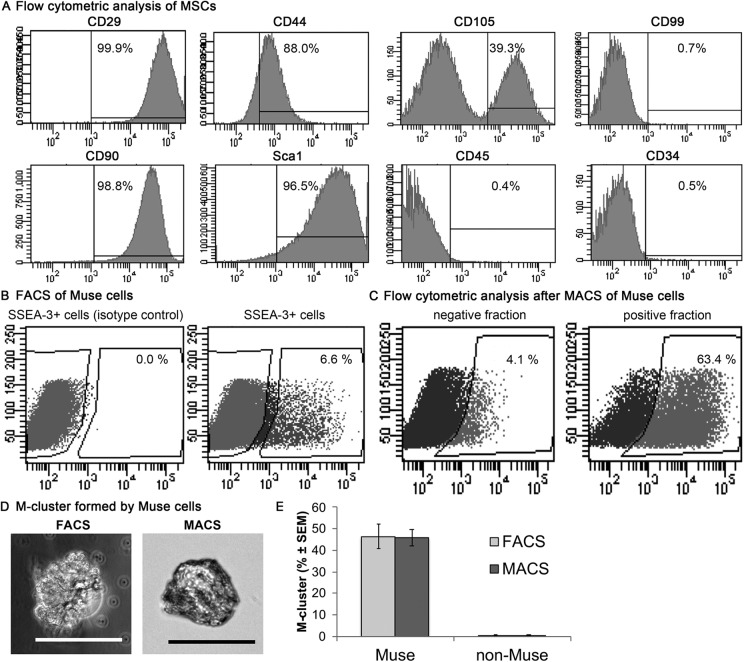
Figure 1.
Separation of SSEA-3+ cells from mouse adipose-MSCs. (A) Expression of MSC surface markers were measured by flow cytometry in MSCs derived from mouse adipose tissue. (B) Representative FACS results showing the SSEA-3+ cells present in mouse adipose-MSCs. (C) Representative flow cytometry analyses after MACS, showing SSEA-3+ cell percentages. (D) Examples of M-clusters formed from a Muse cell recovered after sorting by FACS or MACS. Scale bars = 100 μm. (E) The rates of cluster formation were similar between Muse cells sorted by FACS or MACS (independent-sample t-test, P > 0.05; n = 3/group). FACS, fluorescence-activated cell sorting; MACS, magnetic-activated cell sorting; MSC, mesenchymal stem cell; SSEA-3, stage-specific embryonic antigen-3.

