Figure 3.
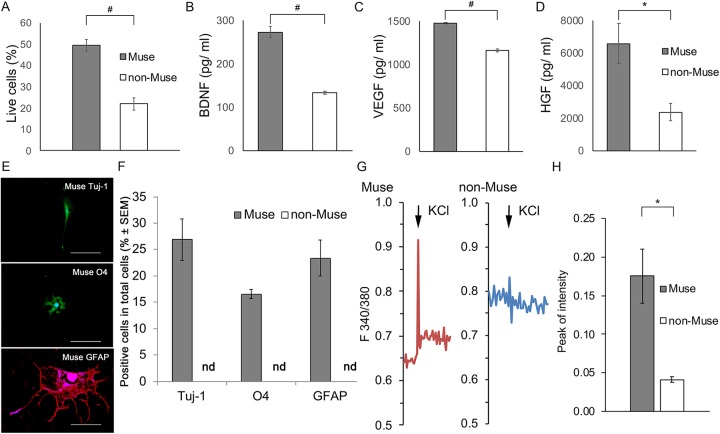
Neural differentiation potentials of mouse adipose-Muse cells. (A) Cell survival following H2O2-induced oxidative stress was significantly higher in Muse cells (gray) than in non-Muse cells (white) (independent-sample t-test, n = 5/group). (B–D) Muse cells secreted significantly higher levels of the neurotrophic factors BDNF (B), VEGF (C), and HGF (D) than did non-Muse cells (independent-sample t-test, n = 4/group). (E) After inducing neuronal differentiation, only Muse cells differentiated into Tuj-1+, O4+, and GFAP+ cells. (F) Percentage of Muse cells and non-Muse cells expressing the indicated markers. Differences in the percentage of Muse cells expressing Tuj-1, O4, and GFAP were not significant (ANOVA and Tukey’s test, n = 6/group). (G) Representative traces of intracellular calcium dynamics (ratiometric acquisition) showing the functional responses of differentiated Muse cells and non-Muse cells after biochemical depolarization with KCL. (H) Quantification of the peak response intensity of differentiated Muse and non-Muse cells following exposure to 50 mM KCL. The responses of differentiated Muse cells were significantly greater than those of non-Muse cells (independent-sample t-test; n = 4/group). Error bars = SEM. #P < 0.005; *P < 0.05. Scale bars = 100 µm. BDNF, brain-derived neurotrophic factor; H2O2, hydrogen peroxide; HGF, hepatocyte growth factor; nd, not detected; VEGF, vascular endothelial cell growth factor.

