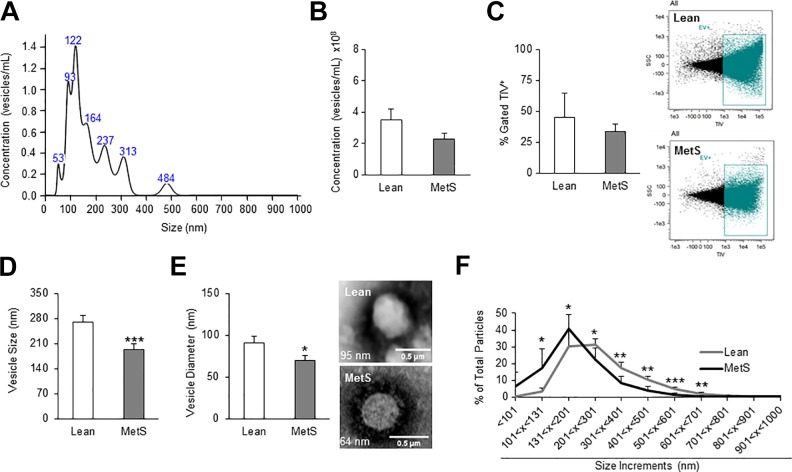
Fig. 1.
Adipose-tissue-derived MSCs from MetS pigs release smaller vesicles. (A) Representative size distribution curve by NTA. (B)–(C). Overall concentration of secreted vesicles in Lean and MetS pigs using NTA and flow cytometry, with EV stained with Tag-it-Violet™, tracking dye. (D)–(F). Average vesicle size (NTA), electron microscopy images showing diameter, and percentage of vesicles separated into size increments to show size distribution in Lean- and MetS-EV. *p ≤ 0.05, **p ≤ 0.01, ***p ≤ 0.005 (vs. Lean).

