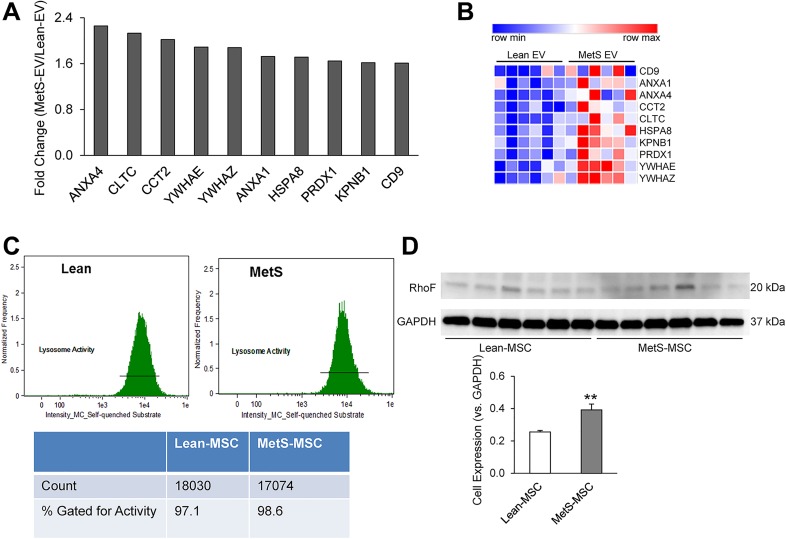
Fig. 2.
Exosome genes are upregulated in MetS-EVs. (A) Statistically significant exosome genes with a fold-change ≥1.4, compared with Lean EV. (B) Heat map depicting the differentially expressed exosome genes in Lean- vs. MetS-EVs. (C) Lysosomal activity assay performed using imaging flow cytometer, showing the intensity of intracellular uptake of the self-quenched substrate and percentage of positively stained cells. (D) Western blot analysis showed increased protein expression of RhoF in MetS-MSC. **p ≤ 0.01, (vs. Lean); BF, Brightfield; SQS, Self-quenched substrate; SSC, side scatter.

