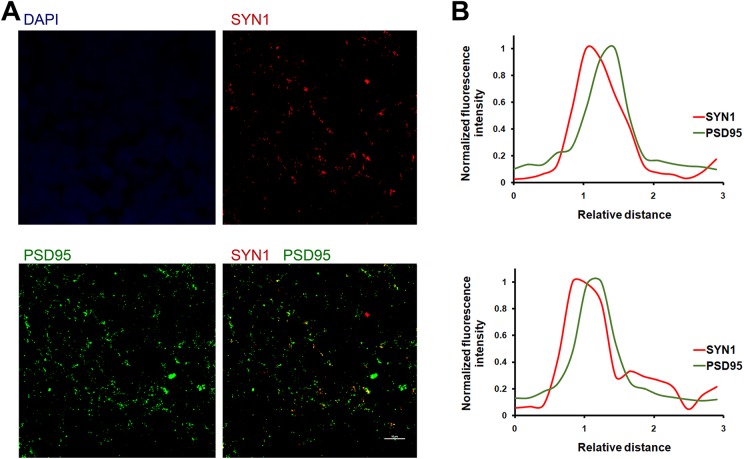
Fig 4.
Synapse analysis using double staining for SYN1 and PSD95. A. An organoid section was stained for SYN1 (red), PSD95 (green), and nuclei (DAPI, blue); scale bar 10 μm. B. Fluorescence–Relative distance analysis for two random Syn1+/PSD95+ punctae in (A), showing the spatial separation of SYN1 and PSD95 peaks, denoting their presynaptic and postsynaptic localizations, respectively. Puncta analysis was performed using Nikon’s NIS-ElementsTM software.

