Figure 2.

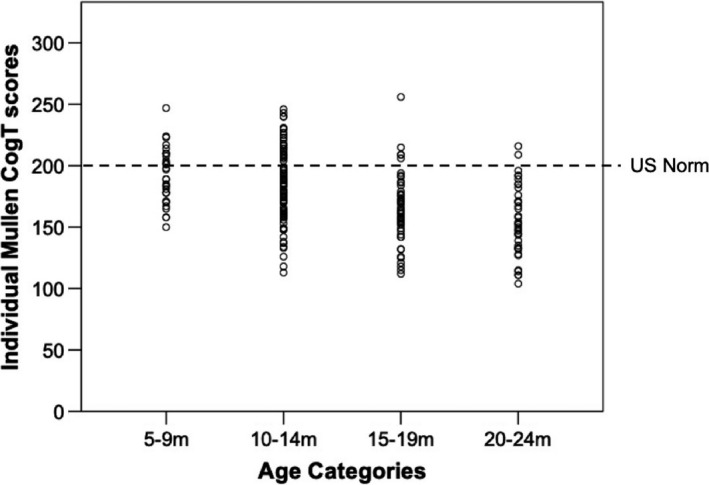
Individual data points for Mullen Scales of Early Learning Cognitive t‐scores in each age group (5–9 m, 10–14 m, 15–19 m, 20–24 m) compared to the US norm

Individual data points for Mullen Scales of Early Learning Cognitive t‐scores in each age group (5–9 m, 10–14 m, 15–19 m, 20–24 m) compared to the US norm