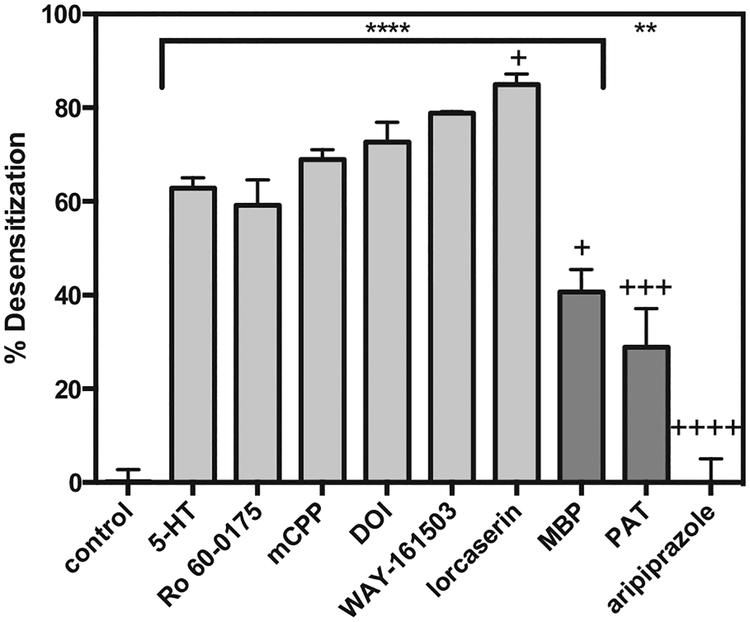
Fig. 3. Agonist–induced desensitization of the 5-HT2C receptor IP pathway.
Cells expressing the 5-HT2C receptor were treated with 1 μM of agonist ligand for 20 h, washed, then re–stimulated with the same agonist (1–10,000 nM). The Emax for each agonist at the desensitized 5-HT2C receptor was compared to the Emax of the agonist at the non–desensitized 5-HT2C receptor (control condition), and reported as percent desensitization. n = 3 or 4; ** = P < 0.01 compared to control; **** = P < 0.0001 compared to control; + = P < 0.05 compared to 5-HT–induced desensitization; +++ = P < 0.001 compared to 5-HT–induced desensitization; ++++ = P < 0.0001 compared to 5-HT–induced desensitization, via one-way ANOVA.

