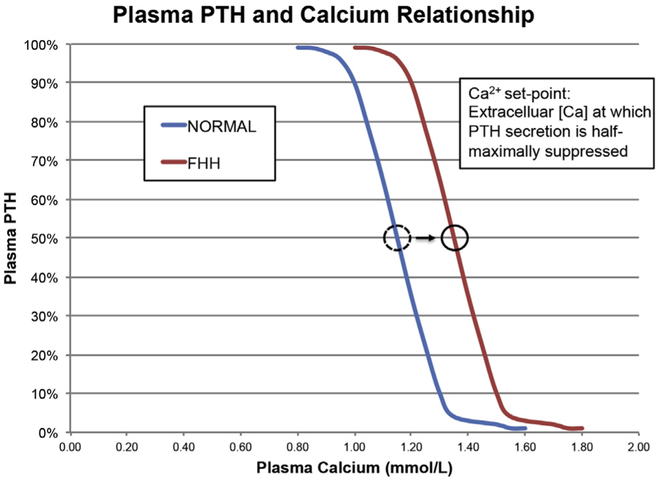
Fig. 2.
Relationship between plasma PTH (expressed asa%of maximal secretion) and plasma ionized calcium (mmol/L) showing the extremely steep relationship between PTH levels in vivo and plasma calcium concentrations (blue curve). The set-point is defined as the plasma or extracellular calcium concentration at which PTH secretion is 50% suppressed versus maximal secretion. Patients with FHH typically have a modest shift to the right in the set-point for secretion as shown (red curve).

