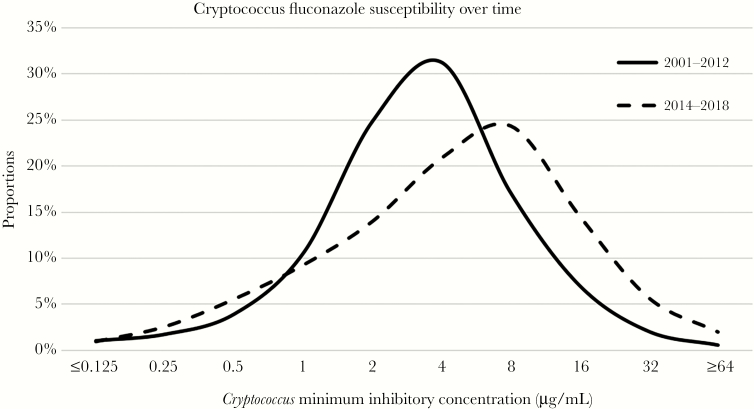
Figure 1.
Fluconazole Minimum Inhibitory Concentration Distribution for Cryptococcus from Years 2001–2012 and 2014–2018
Minimum inhibitory concentration distribution of 11 049 clinical isolates published from January 1, 2000, to May 31, 2018, were normally distributed with a geometric mean of 3.4 µg/mL, median (MIC50) of 4 µg/mL, and 90th percentile (MIC90) of 16 µg/mL. When divided into 2 groups from the publication years of 2000–2012 (13 studies, n = 9507) and years of 2014–2018 (8 studies, n = 1542), the median MIC50 was up trending from 4 µg/mL to 8 µg/mL.

