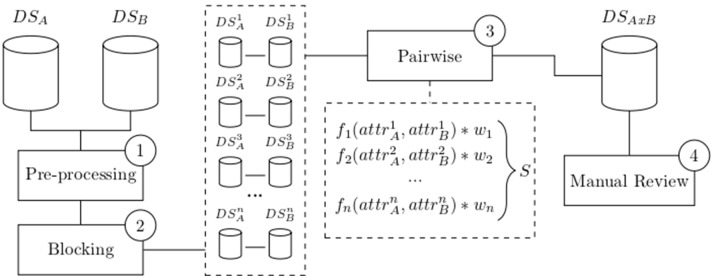
Figure 1.
Common flowchart of a data linkage tool: Raw data are pre-processed (1) and split into smaller blocks (2). Pairwise comparison is performed among records within similar blocks using functions that produce a similarity measure for each attribute. A weighted vector is then used to average each individual similarity measure into a single score S (3). Manual review the dataset generated after the pairwise comparison is optionally performed (4). Data source A (DSA), data source B (DSB), number of blocks (n), attributes (attr), weights (w), score (S), and linked data DSAxB.

